 trailscope
See every request your API handles
Open-source request logging on your own server. Filter every request with SQL, open the one that failed and follow a customer across services and background jobs.
SDKs for the frameworks you already use
- Express
- Fastify
- NestJS
- Django
- FastAPI
- Celery
- Laravel
- Spring Boot
- OpenTelemetry
Answers in the request itself, not in a pile of log lines
Your API already knows what happened. Trailscope keeps every request with its context, so "what did this customer see at 14:02?" takes seconds, not an afternoon.
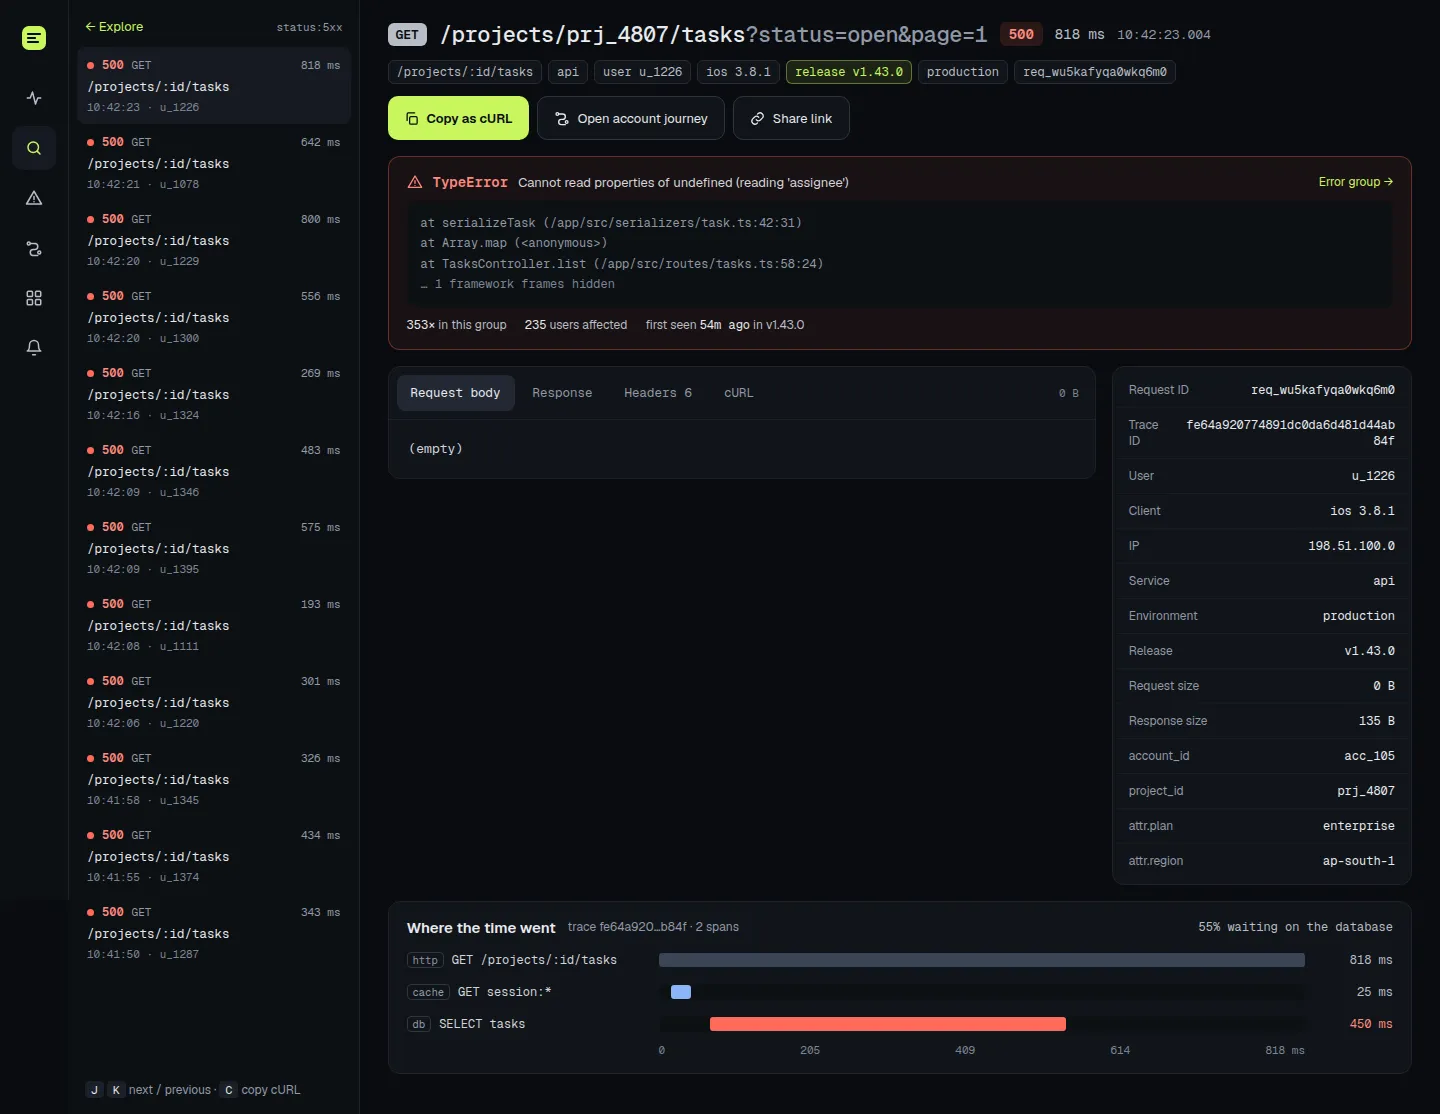
Inspector In the app, Enter opens the selected request↵
Open the request that failed
See what was sent and answered, the error with its stack, and where the time went.
- Headers, bodies, user, release and journey keys
- A timing waterfall of the spans inside the request
- Copy as cURL or replay it against staging
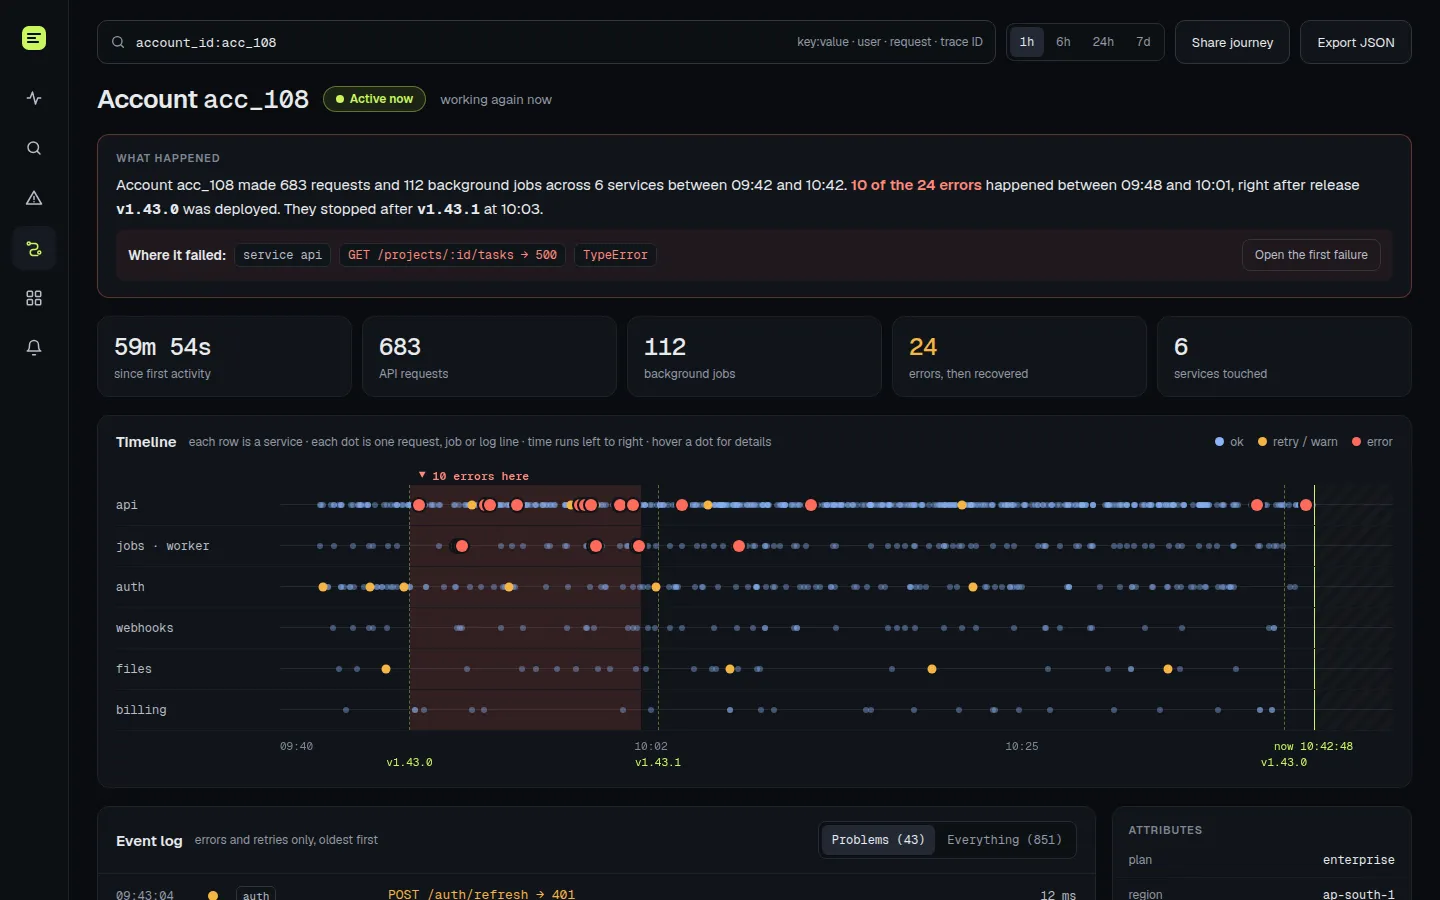
Journeys In the app: G then JGJ
Follow one customer across everything
Tag requests with a user, account, order or session, and Trailscope puts everything for it on one timeline, across services, background jobs and log lines.
- Jobs and log lines started from a request are linked automatically
- Answer support tickets with what actually happened
Explore In the app: G then EGE
Filter with the SQL you already know
Write a WHERE clause, use quick search, or click filter chips. Group by any column with p50, p95 and p99, and share the view as a link.
status >= 500 AND route LIKE '/checkout/%'status:5xx user:u_42 duration:>1sUnder half a second over 102 million requests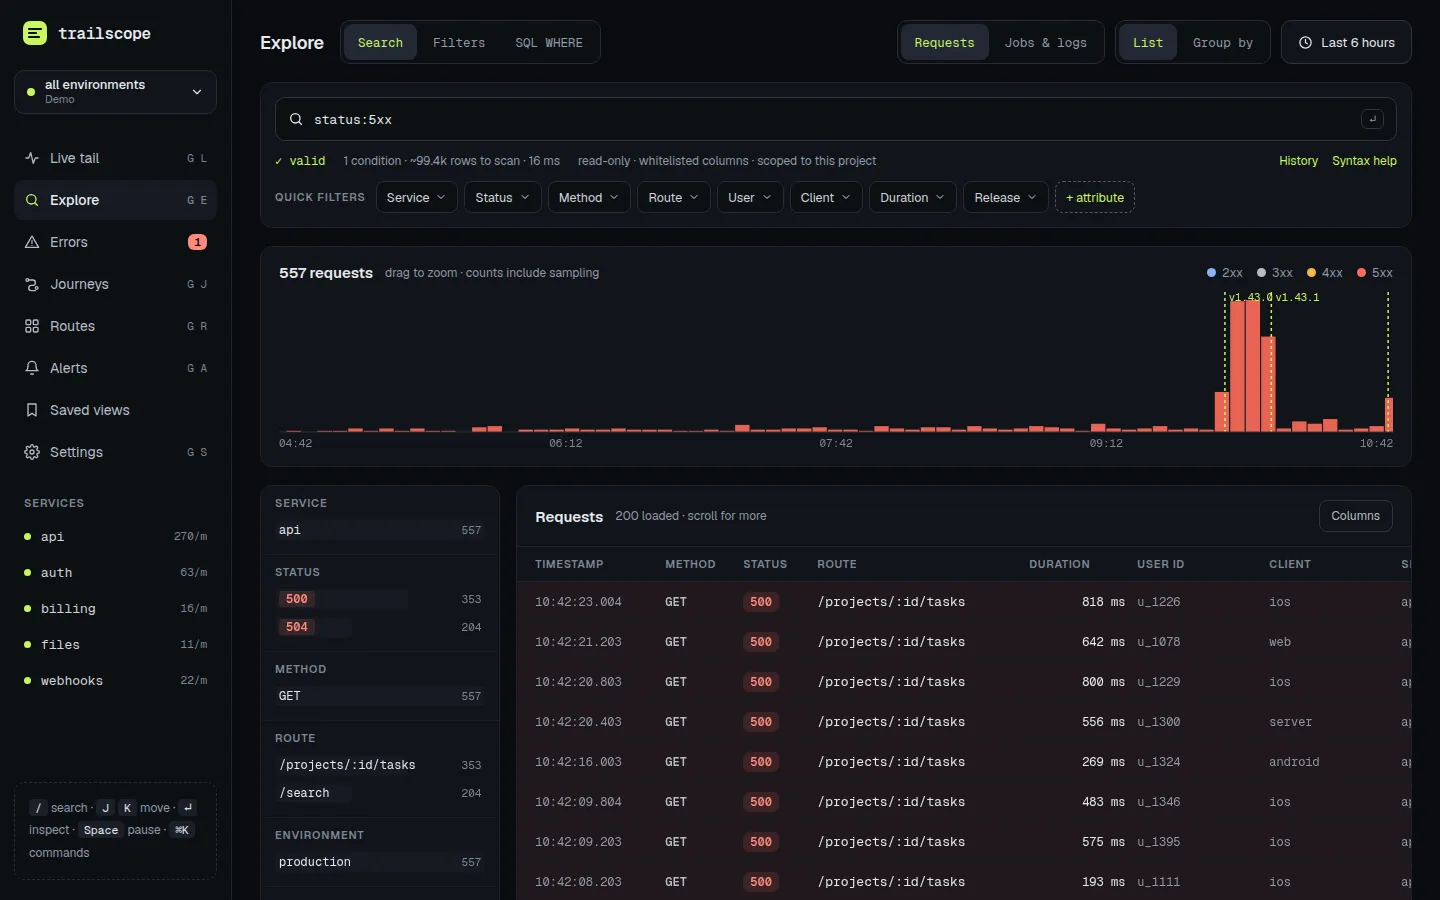
Errors and routes In the app: G then RGR
Find the release that broke it
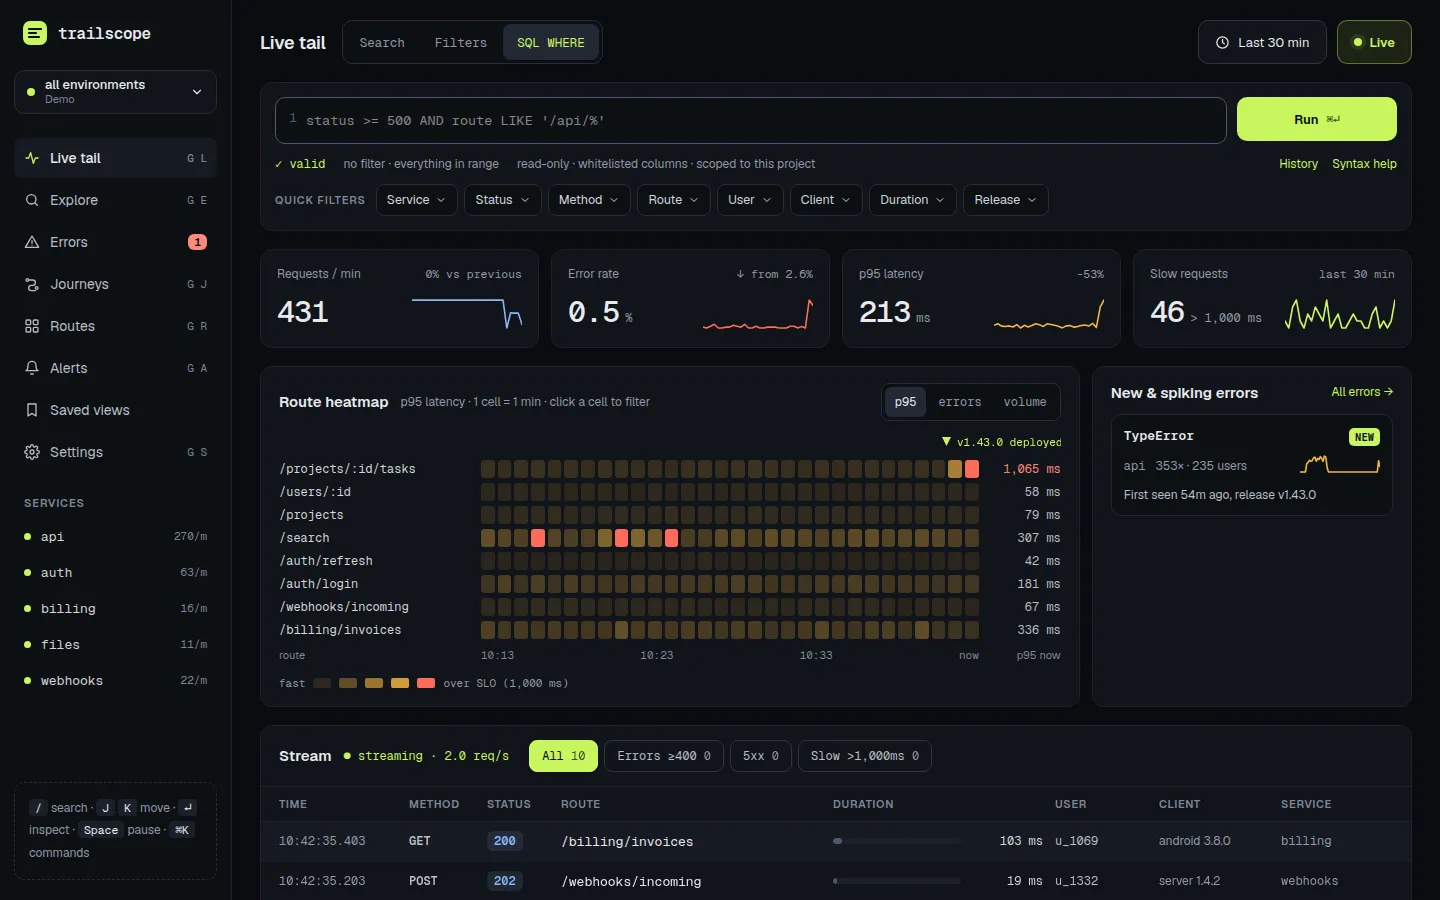
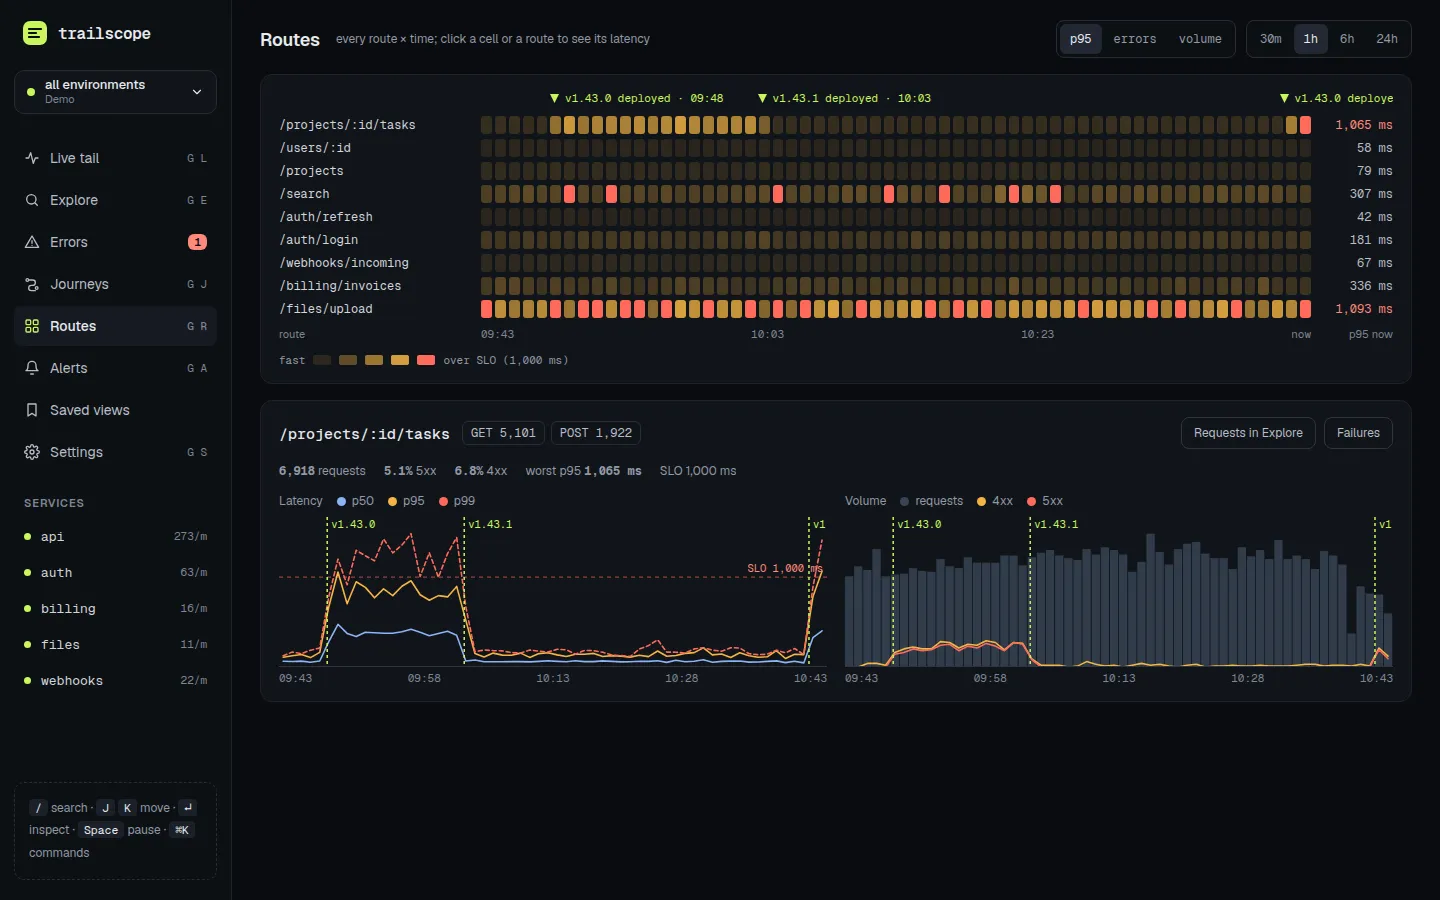
Errors are grouped by fingerprint with first and last seen, users affected and the release that introduced them. The route heatmap shows latency and errors per minute, with every deploy marked.
- New and spiking errors on the live tail
- Release markers on every chart
Built for the team that gets paged
Live tail
Requests on screen within a second, with live tiles, a route heatmap and new errors as they appear
Alert rules
On 5xx rate, p95 latency, counts or new and spiking errors, to email, Slack, Telegram or signed webhooks
Email on 5xx
Hear about server errors in real time, with throttling, digests, regression notices and one-click mute links
Copy as cURL, replay
Reproduce any request from your terminal, or replay it against a staging server you allowed
Redaction, twice
Passwords, tokens and card fields are masked in your app before sending, and again on the server
Roles and body access
Owners, admins, members and viewers, plus a separate permission to see request and response bodies
Single sign-on
Sign in with any OpenID Connect provider: Google, Microsoft Entra, Okta, Keycloak and others
OpenTelemetry
Point any OTLP/HTTP exporter at Trailscope and your spans become requests, for stacks without an SDK
A few lines, and every request shows up
The SDKs send in the background, add at most 0.05 ms per request, and mask passwords and tokens before anything leaves your process.
npm install @trailscope/expressimport express from 'express';
import { init, trailscope, trailscopeErrorHandler } from '@trailscope/express';
init({ service: 'orders-api' }); // endpoint and ingest key from the environment
const app = express();
app.use(trailscope());
// ... your routes
app.use(trailscopeErrorHandler());npm install @trailscope/nestjsimport { Module } from '@nestjs/common';
import { TrailscopeModule } from '@trailscope/nestjs';
@Module({ imports: [TrailscopeModule.forRoot({ service: 'orders-api' })] })
export class AppModule {}pip install trailscopeimport trailscope
from fastapi import FastAPI
from trailscope.asgi import TrailscopeMiddleware
trailscope.init(service="orders-api")
app = FastAPI()
app.add_middleware(TrailscopeMiddleware)pip install trailscopeMIDDLEWARE = ["trailscope.django.TrailscopeMiddleware", ...]
TRAILSCOPE = {"service": "orders-api"}composer require trailscope/trailscopeTRAILSCOPE_ENDPOINT=https://trailscope.example.com
TRAILSCOPE_INGEST_KEY=trs_ingest_…
TRAILSCOPE_SERVICE=orders-api<dependency>
<groupId>pro.trailscope</groupId>
<artifactId>trailscope-spring-boot-starter</artifactId>
<version>0.1.0</version>
</dependency>trailscope.service=orders-apiOTEL_EXPORTER_OTLP_ENDPOINT=https://trailscope.example.com/v1/otlp
OTEL_EXPORTER_OTLP_HEADERS=Authorization=Bearer%20trs_ingest_…Then call setUser(id) or setCorrelation('order_id', id) anywhere in a request to make it part of a journey. All SDKs
One Rust binary, ClickHouse and Postgres
Everything runs on one small machine. ClickHouse stores a request in about 70 bytes, so 100 million requests take under 7 GB of disk.
Measured and reproducible: how we benchmarked
Your services
- Trailscope SDKsNode, Python, PHP, Java
- OpenTelemetryany OTLP/HTTP exporter
- Plain HTTPgzipped JSON batches
Trailscope, on your server
- Ingestvalidates, redacts and groups errors, then batches
- ClickHouserequests, spans, events and rollups
- Postgresusers, projects, alerts and settings
Your team
- Web UIlive tail, Explore, journeys, errors
- Alertsemail, Slack, Telegram, webhooks
- HTTP APIwith tokens and OpenAPI
Running in about a minute
All you need is Docker. The setup wizard does the rest.
Start it
Trailscope, ClickHouse and Postgres in one Compose file, with the published server image.
git clone https://github.com/karaa1122/trailscope
cd trailscope/deploy
echo TRAILSCOPE_IMAGE=ghcr.io/karaa1122/trailscope:latest >> .env
docker compose up -d
Create your project
Open
http://localhost:8080. The wizard creates your account and first project and shows its ingest key.docker compose exec trailscope \ trailscope demo --url http://localhost:8080
Optional: demo traffic with a scripted incident.
Add the SDK
Install the package for your framework and set two environment variables. Production setup, TLS and backups: self-hosting guide.
TRAILSCOPE_ENDPOINT=http://localhost:8080
TRAILSCOPE_INGEST_KEY=trs_ingest_…
Rather not run it yourself?
We're building a hosted Trailscope: the same software, run for you, with nothing to install beyond the SDK. Leave your email and we'll write when it opens.
- Early access before the public launch
- One email when it's ready, no newsletter
- EU hosting at launch